TrailBlazer v2.0 Quick Start Guide
Welcome to TrailBlazer
Embark on your forecasting journey with TrailBlazer using these essential tips.
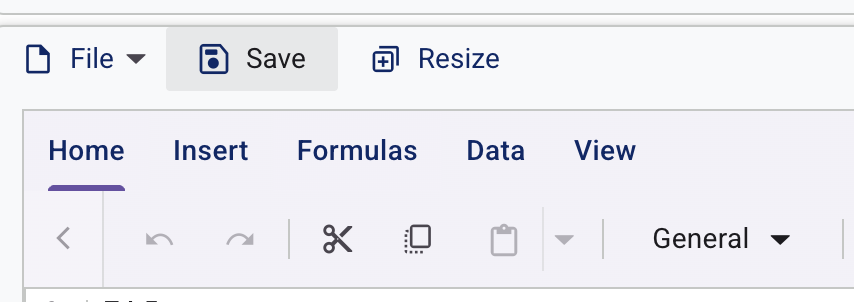
Run a Forecast w/ Sample Data
Quick Workflow: File → Open → Sample Data → Import → Forecast
1. Upload your Time-series Data
AI Import Agent: Upload CSV Files w/ Time series Data
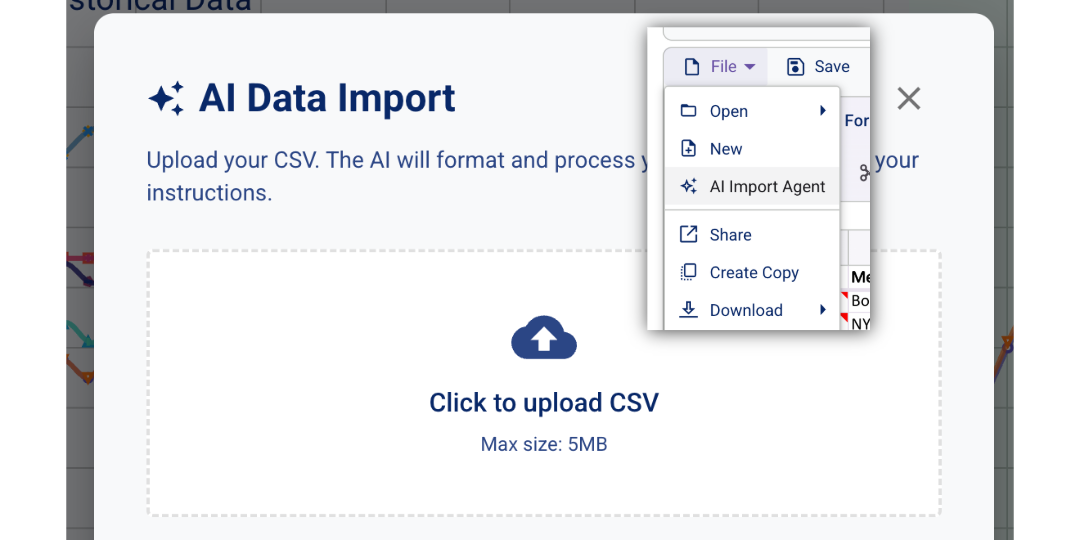
File -> AI Import Agent, upload your times series CSV data into TrailBlazer.
- File Requirements: No strict format needed, just time-series data associated w/ dates, 5MB .csv size limit.
- AI Instructions: Custom instructions for data extraction (e.g., “Load only last 3 Years of Data for first 10 products”, “Return just merchandise sales from start of 2023 to end of 2025”).
Start New Spreadsheet -> Copy and Paste from Excel into TrailBlazer
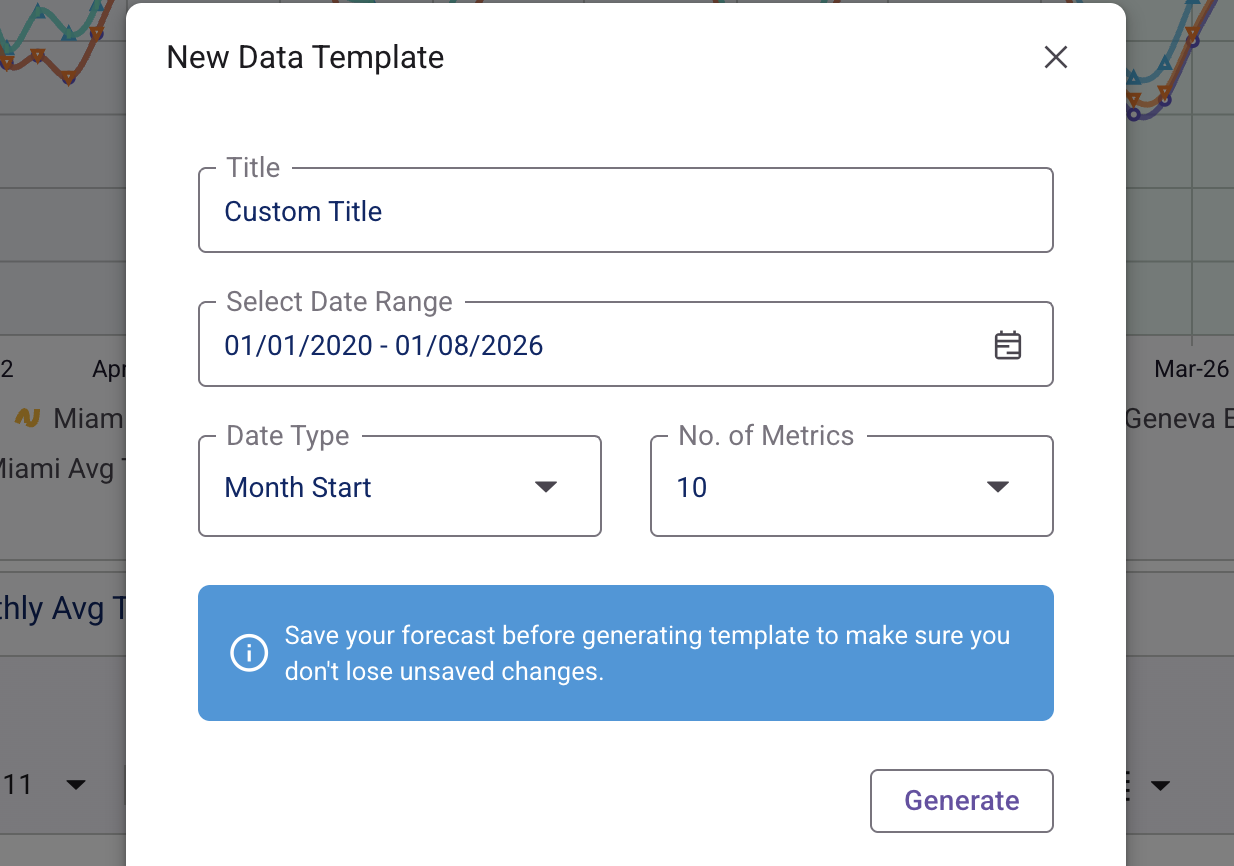
Select File option in the Spreadsheet component, and click New to create a blank template for TrailBlazer.
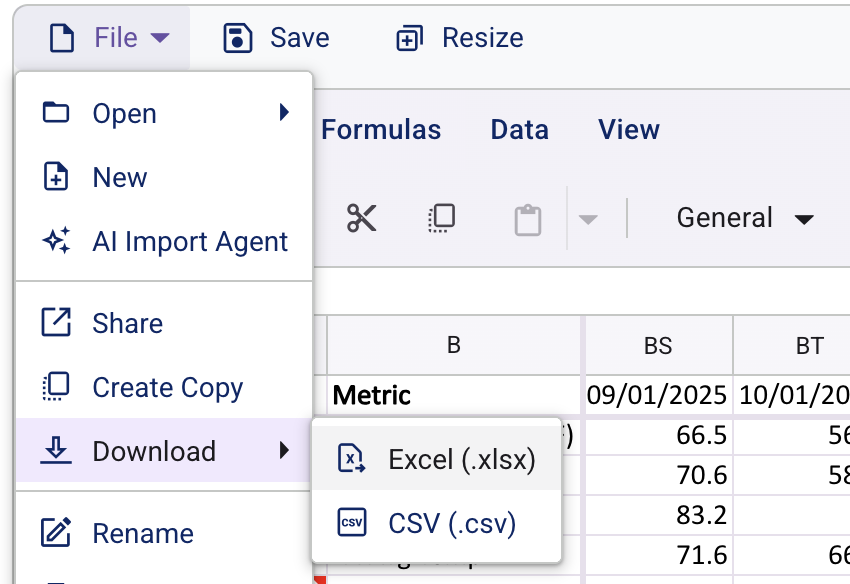
Download Data Template to Excel -> Add Time Series Data -> Re-Upload
After creating a New Data Template, Select File option in the Spreadsheet component, and hover over Download then click Excel.
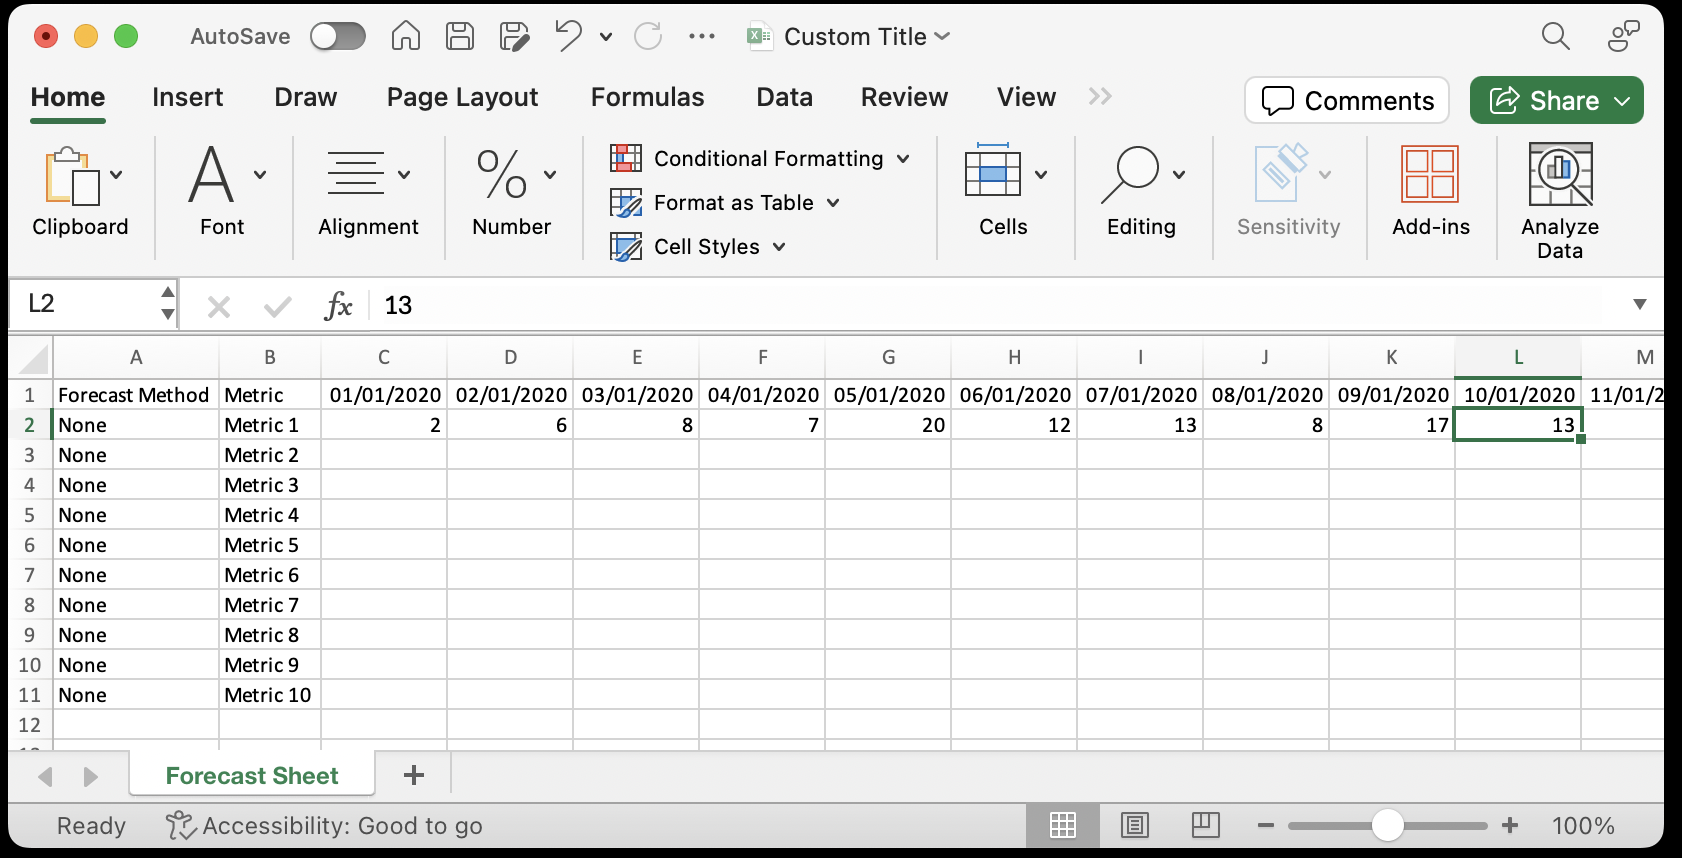
In Excel, add Time-series data to your template.
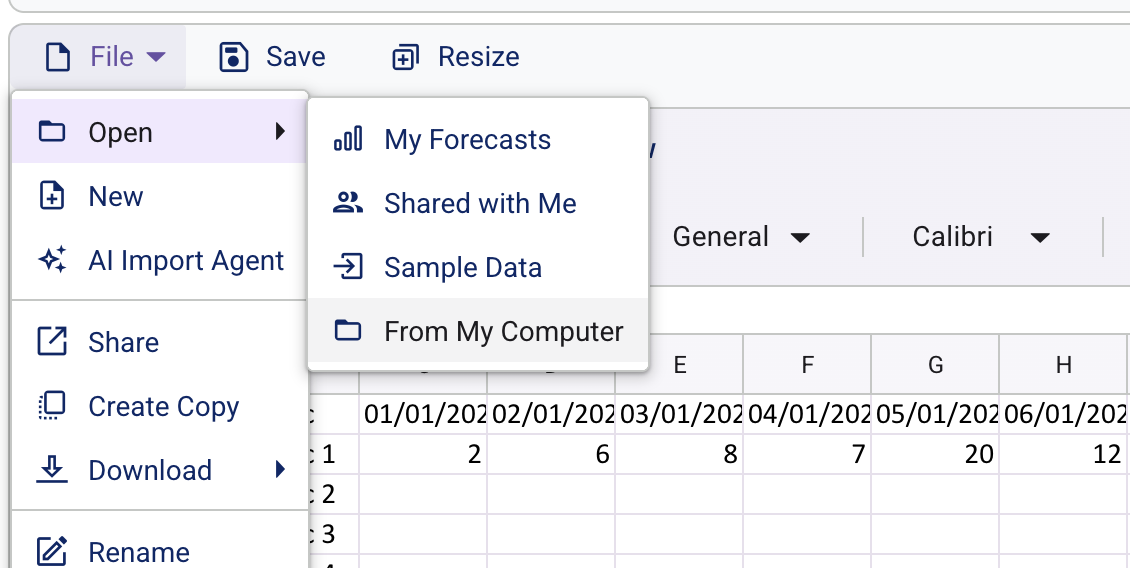
Re-Upload Excel File into TrailBlazer, Select File, then Open, then click From my Computer and select your Excel file.
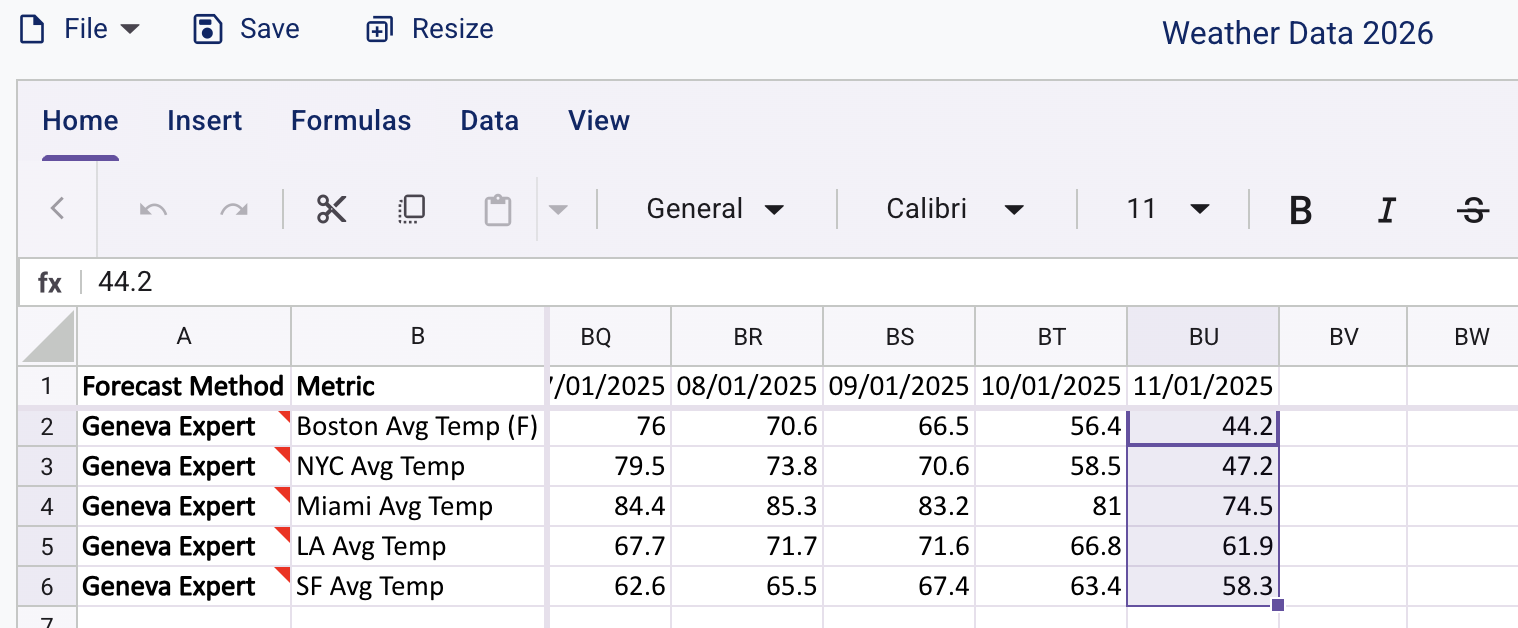
Note: Once your data is loaded in TrailBlazer format, the chart will populate automatically, and you can begin forecasting.
2. Running Forecasts & Model Configuration
Select Cell(s) in Spreadsheet
Select a single cell or multiple rows before running Forecast.
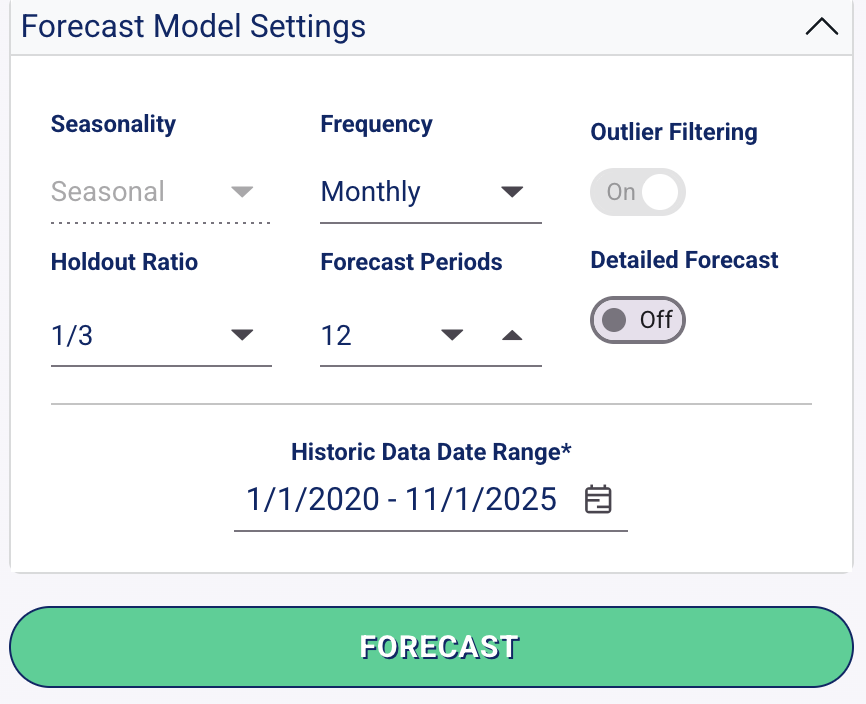
Quick Check: Confirm Historic Data Date Range, Frequency, and Forecast Periods
TrailBlazer auto-detects the Historic Data Date Range and Frequency within the Spreadsheet, but double check the configuration to insure accurate forecasting.
Run Forecast
Click the Forecast Button under the Forecast Model Settings and see Forecasted values in Spreadsheet & Chart.
Model Configuration
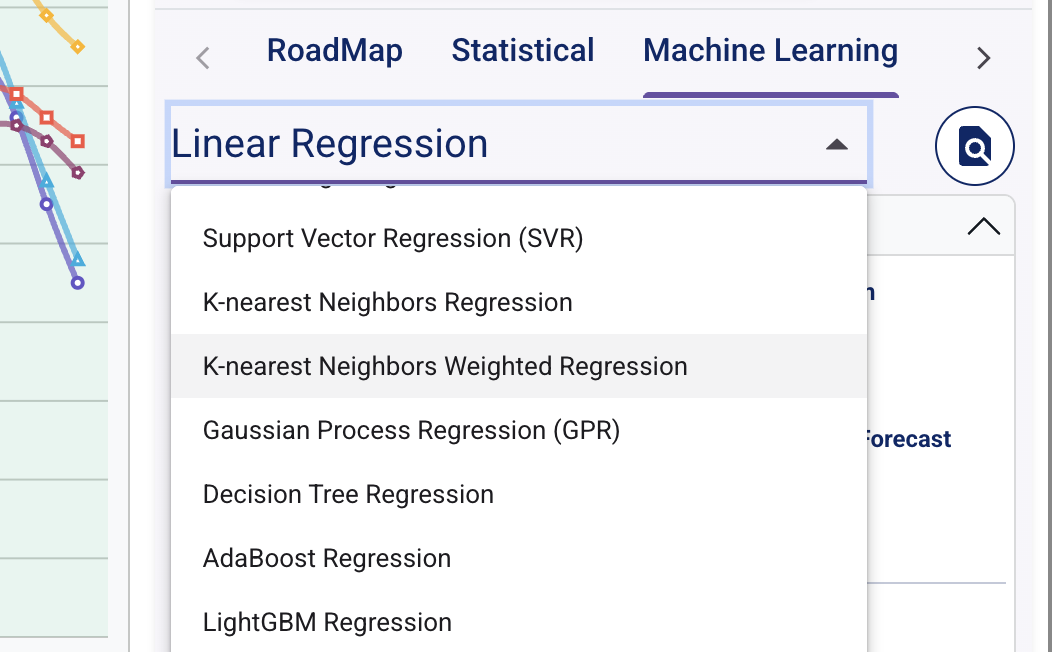
Forecast Model Selection TrailBlazer enables users to use a variety of Forecasting Models in order to find the best model for your data set. Model Performances vary dataset to dataset, TrailBlazer allows users to run over 45+ Forecasting models on their data.
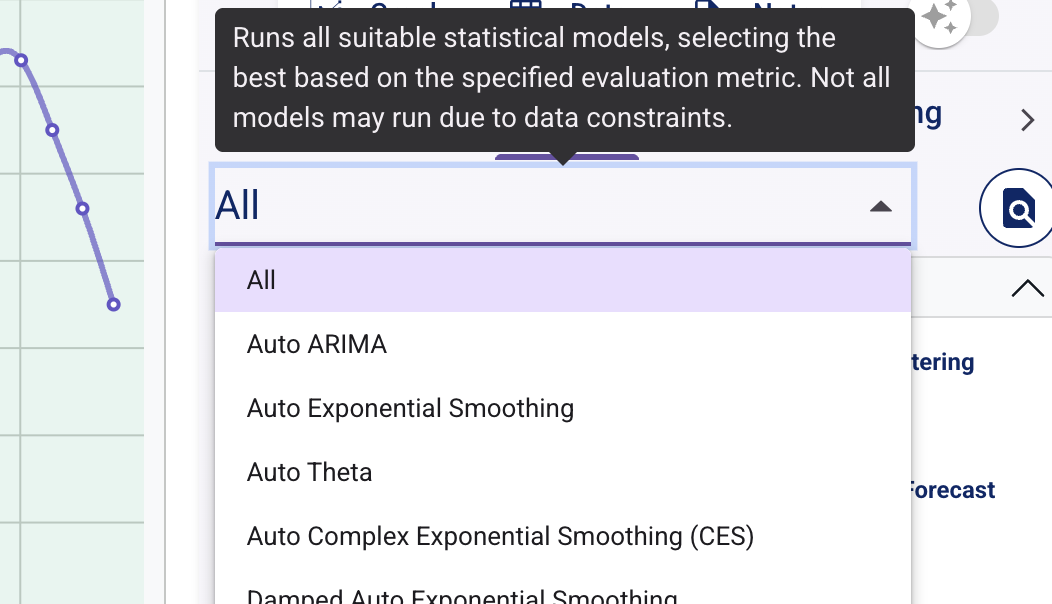
“All” - Method Explained Selecting All in the Statistical / Machine Learning / Deep Learning Categories will run all the forecasting models within that category and return back the best performing model.
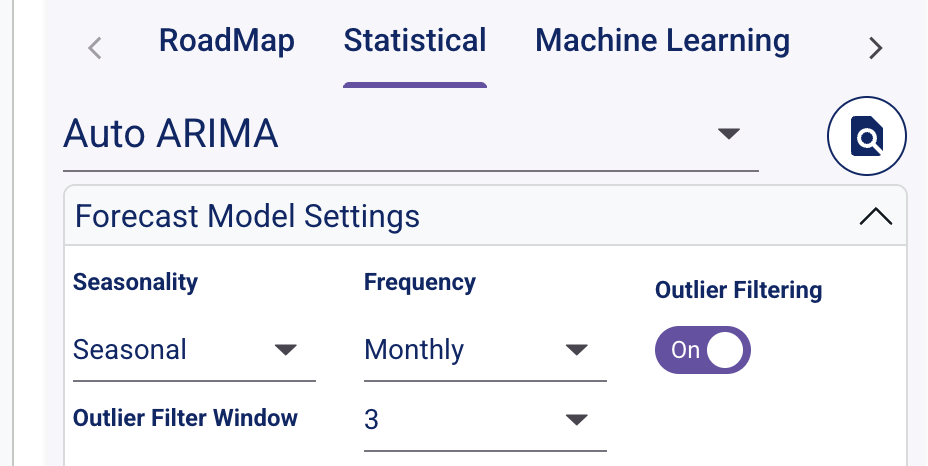
Outlier Filter A moving median filter that iterates through each data point, replacing it with the median value of a defined window centered on that point. Outlier Filter Window can be set on certain models and customized.
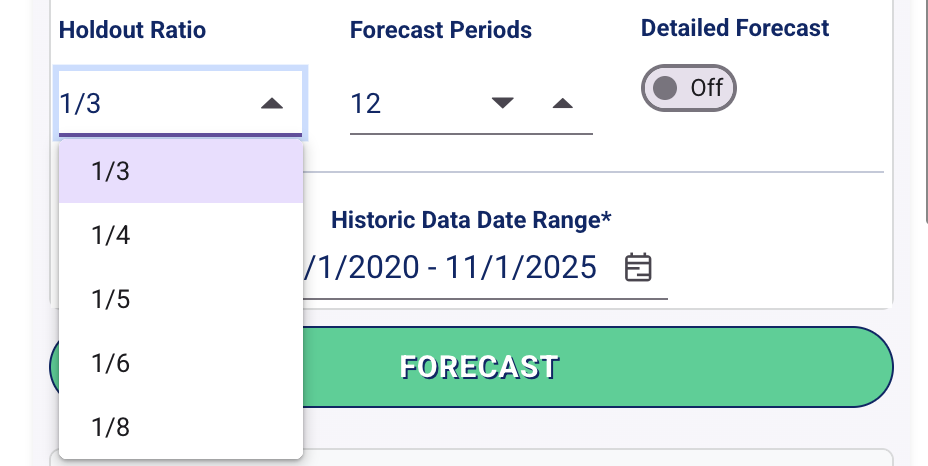
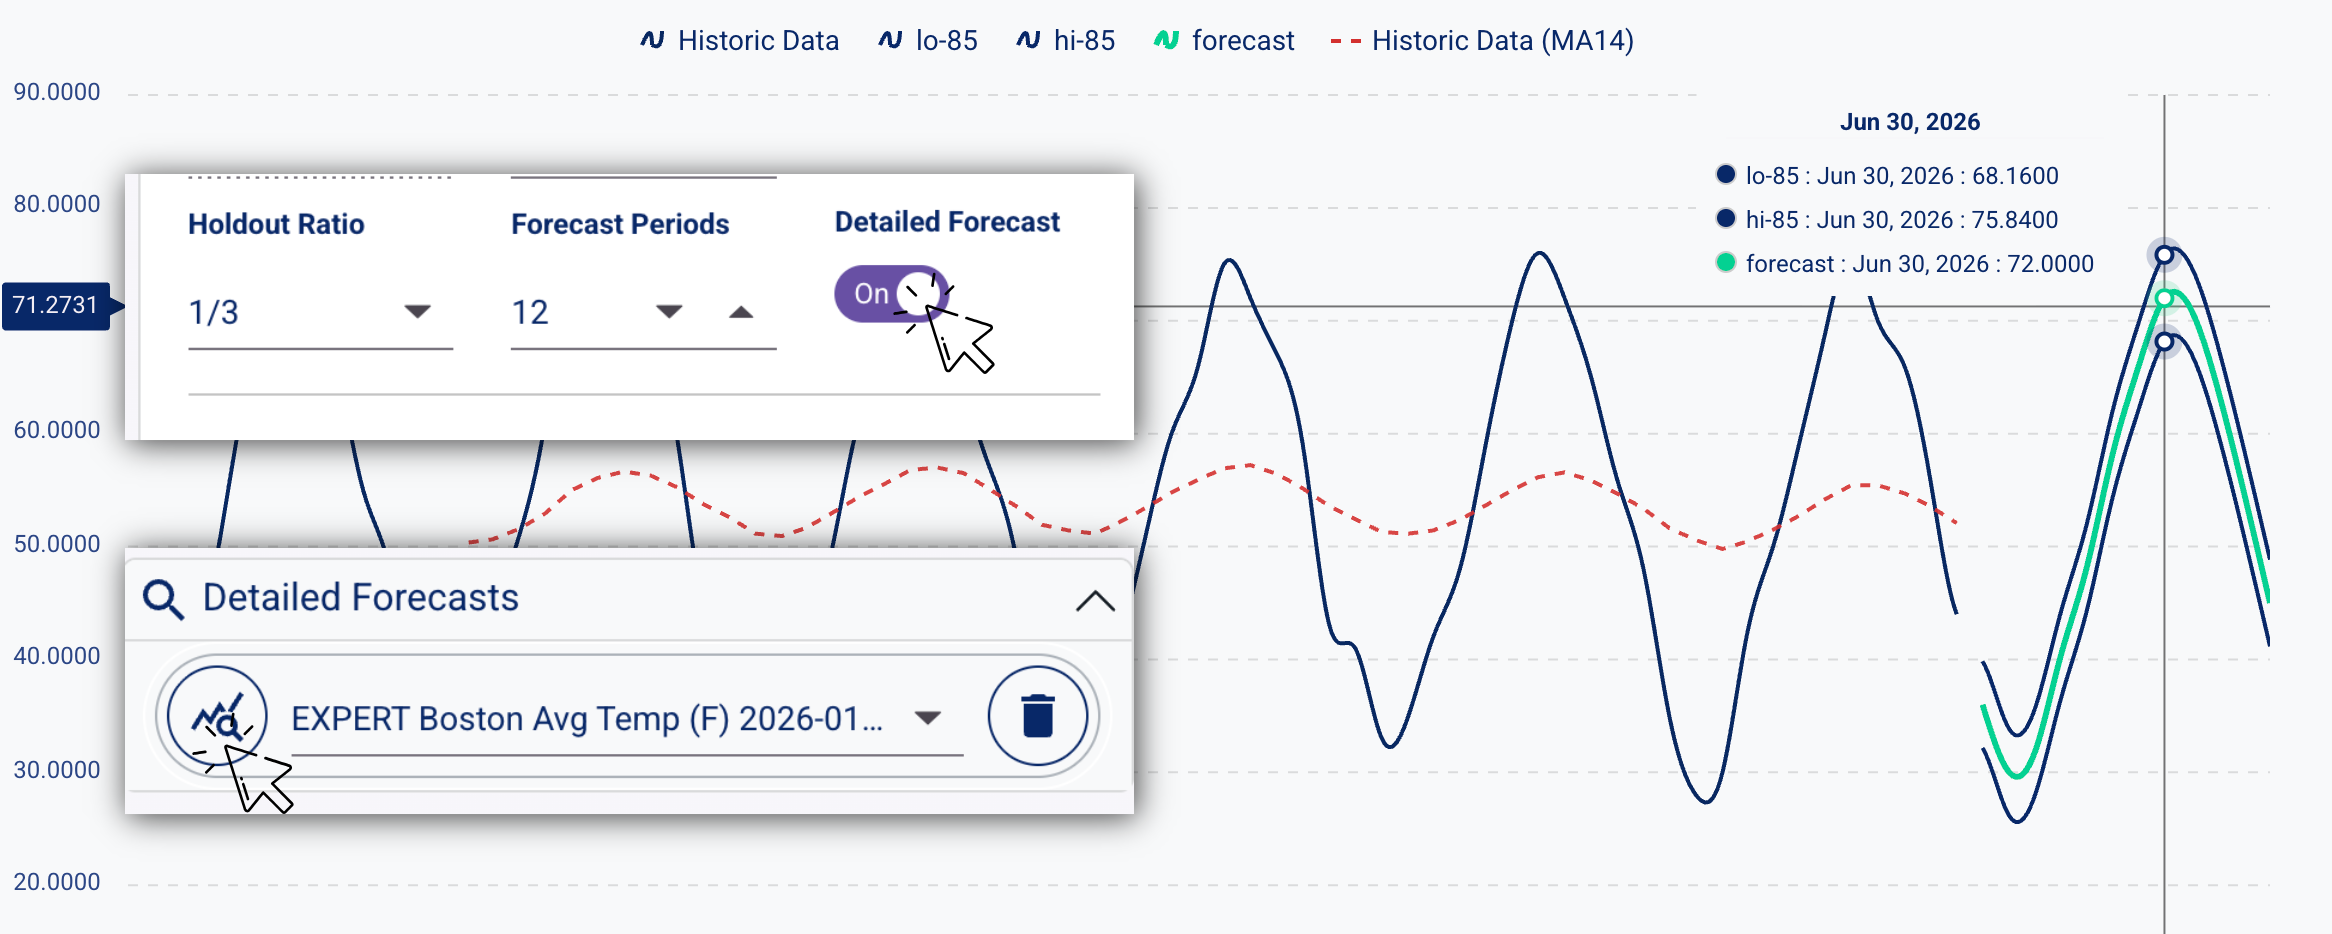
Holdout Ratio The Holdout Ratio is the percentage of recent historical data reserved to evaluate model performance. During cross-validation, this data is hidden from the model. For example, with a 1/3 ratio, the model learns from the first two-thirds of the timeline and attempts to predict the remaining third. These predictions are then compared against the actual data to determine how accurate the model is.
Detailed Forecasts: Confidence Intervals When selecting Detailed Forecast option, TrailBlazer will generate a confidence interval of for each Forecast. Accessible in the Detailed Forecasts dropdown in the control panel. Probabilistic Forecast Methods such as Conformal Prediction can be selected for Statistical, Machine Learning, and TimeGPT forecast models.
3. Forecast Results: Chart & Performance Metrics
Visualize Forecast
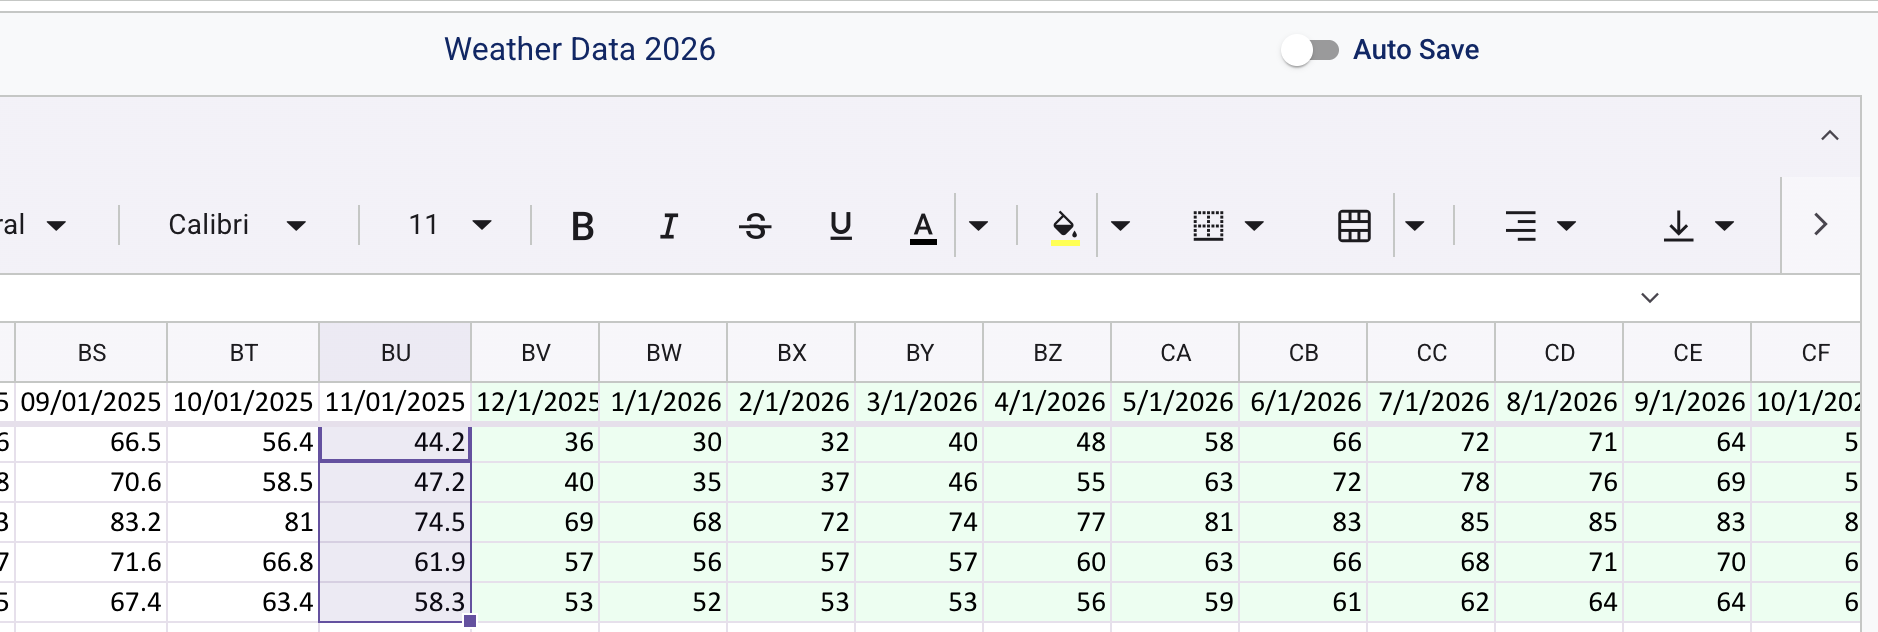
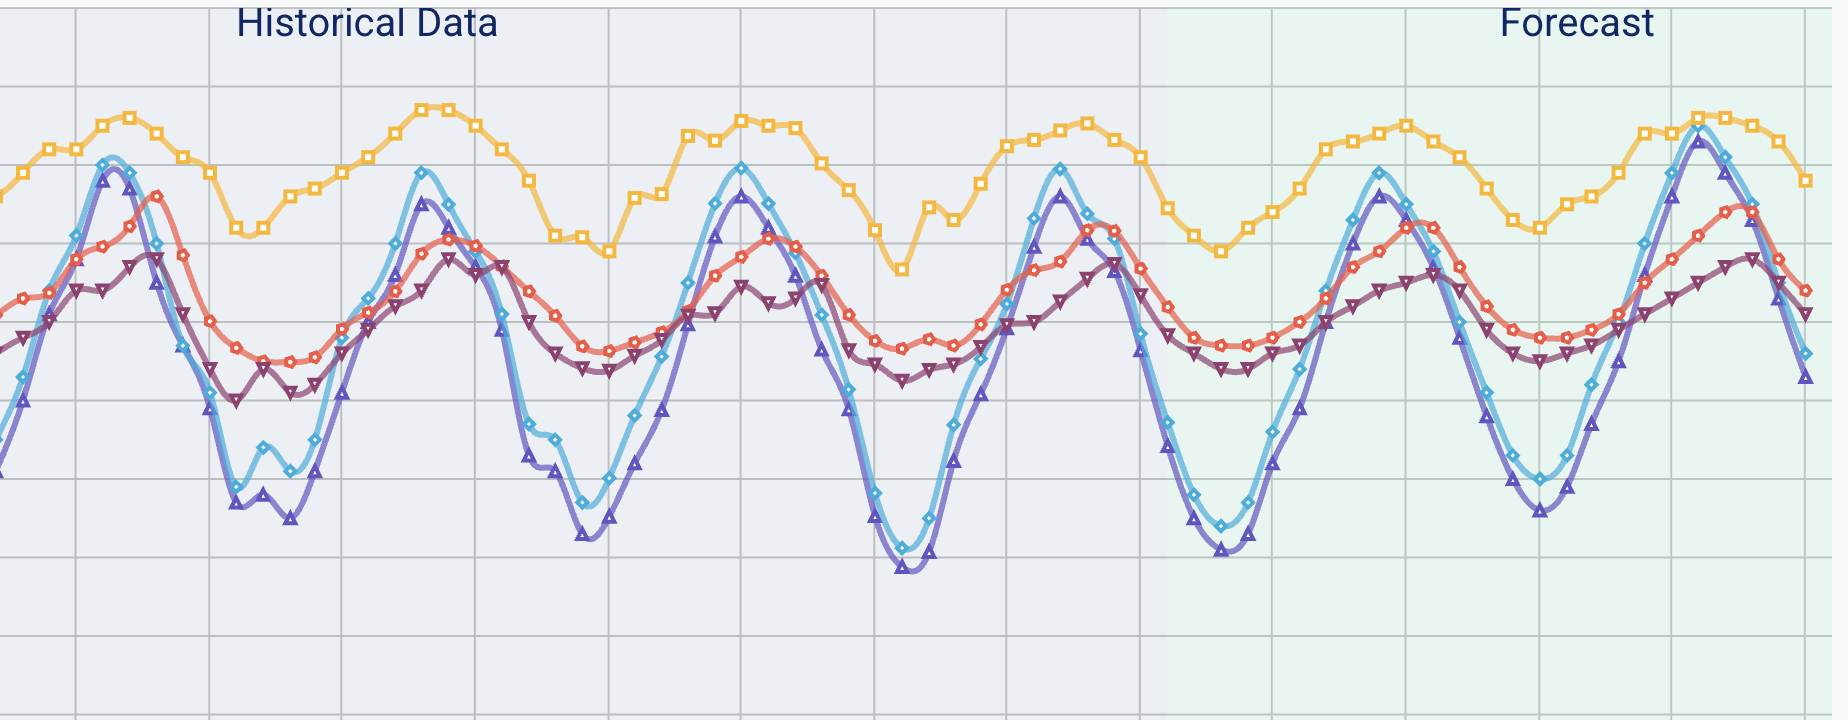
After Running your Forecast(s), you will see the chart automatically visualize your most recent forecasts.
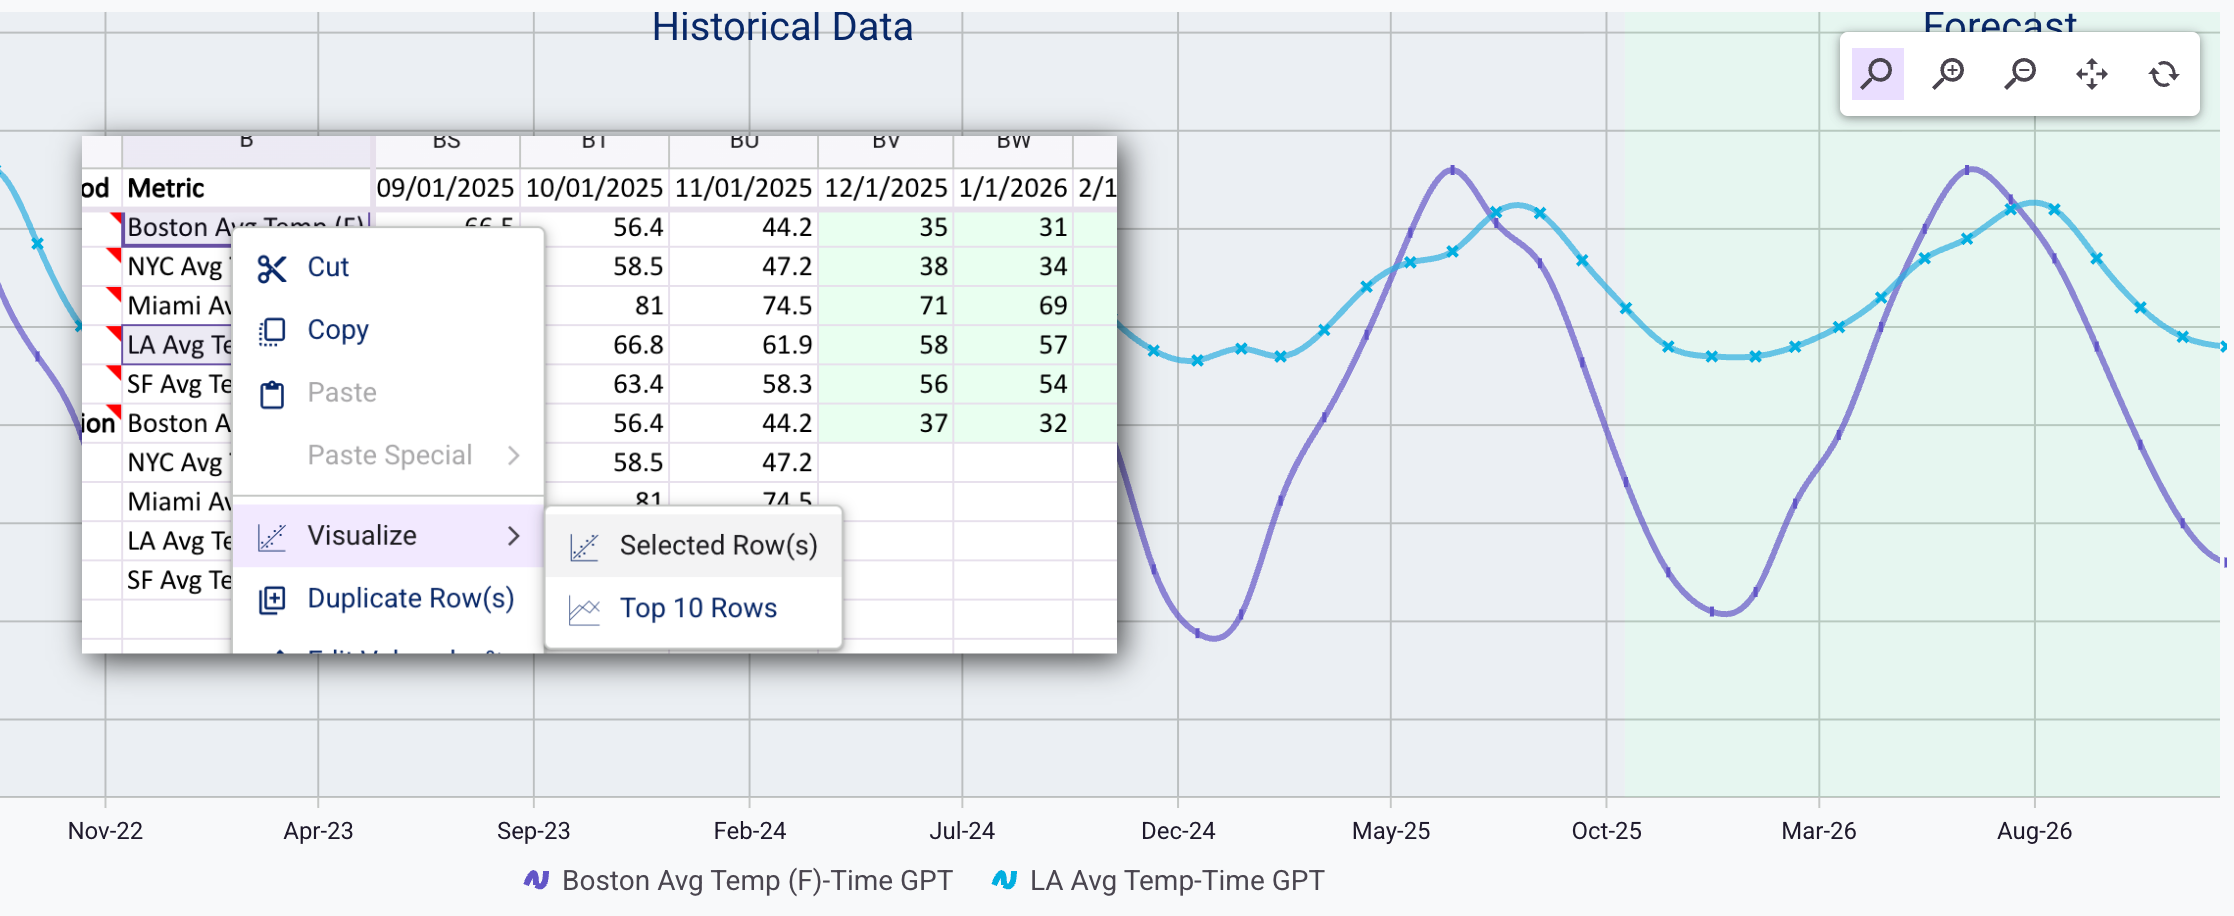
Visualize Specific Time-Series
Select any cell(s) in row(s) you wish to visualize, Right Click, and select Visualize -> Selected Row(s).
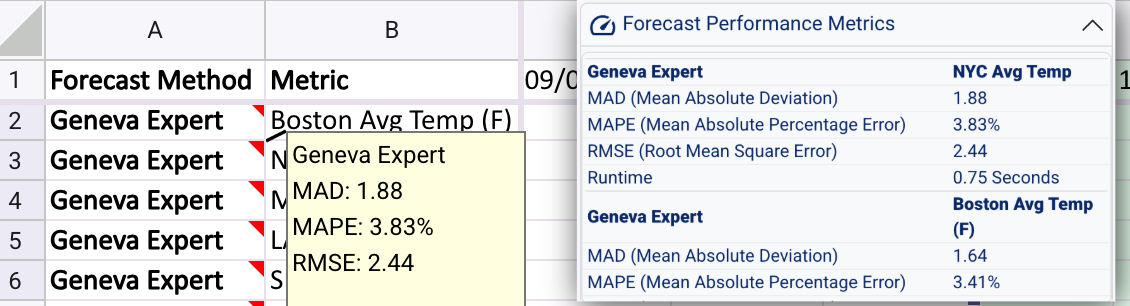
Performance Metrics
Performance Metrics allow you to measure accuracy using standards like RMSE, MAD, MAPE, or MAE. These scores are essential for identifying which forecasting model fits your specific data best. After running a forecast, you can view these results in the Forecast Performance Metrics dropdown or as comments within the Forecast Method Column.
4. Saving & Exporting: Spreadsheet & Charts
Save to TrailBlazer
Spreadsheet, forecast, and notes are saved directly to TrailBlazer.
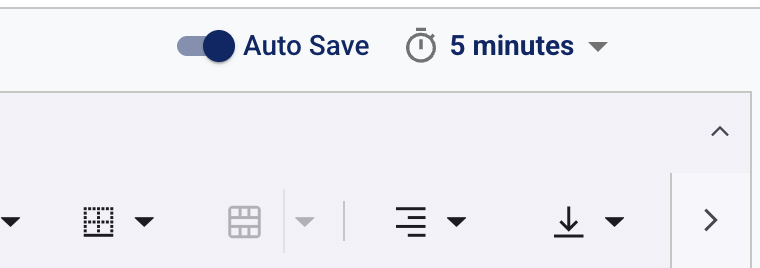
Auto-Save to TrailBlazer
Auto-save allows users to periodically save their Forecasts to TrailBlazer at a set interval.
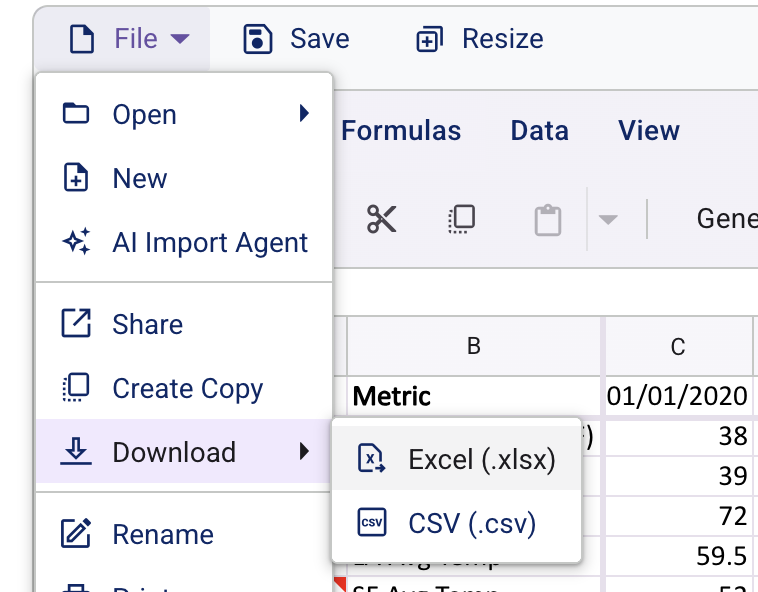
Save .xlsx or .csv to Local Desktop
Download your data as CSV or Excel files to your local computer.
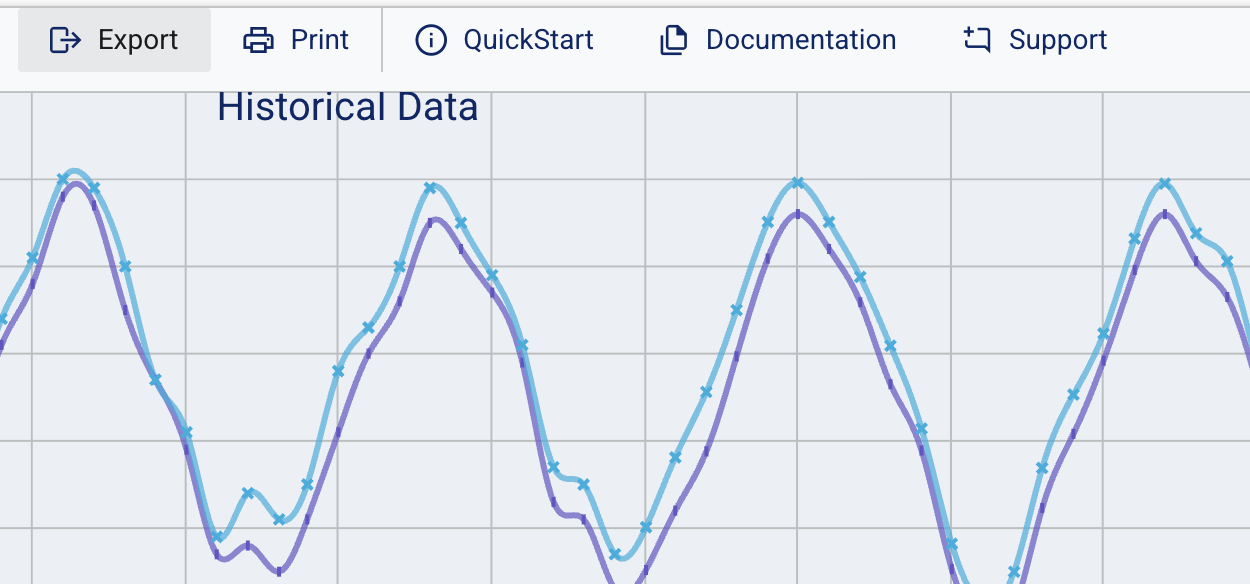
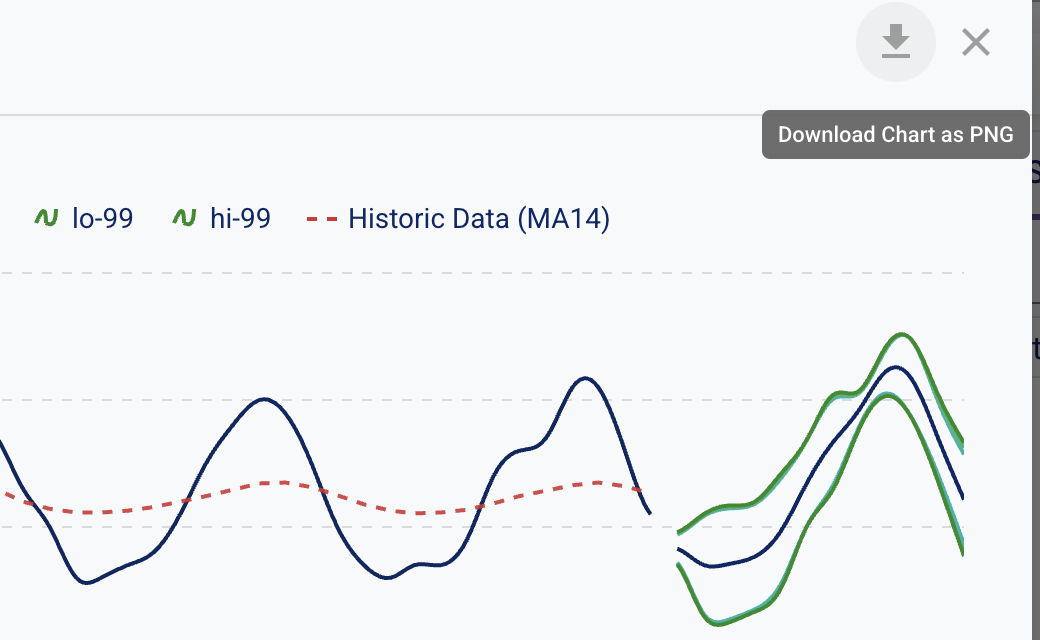
Download Chart as .pdf / .png / .jpg / .svg
Use the export button above the graph to save the forecast visualization as an image to local desktop.
Download Detailed Forecast Chart as .png
Select a detailed forecast and click on the Download button in the top right of the modal.
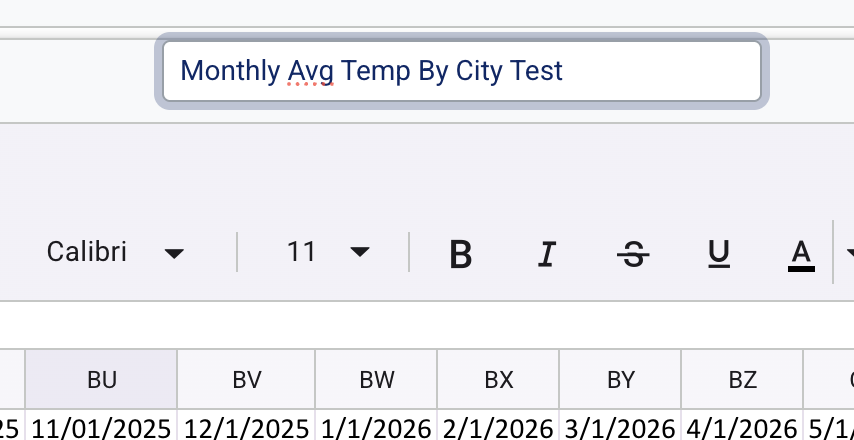
Rename Spreadsheet/Forecast Data
Change the title of the current Spreadsheet by simply clicking on the Title, editing the title, and saving the Spreadsheet.
5. Share Forecast with other TrailBlazer Users
Share a Copy of your Forecast
Share your current Forecast by going to File -> Share, and adding the Email Address associated with another user’s TrailBlazer account.
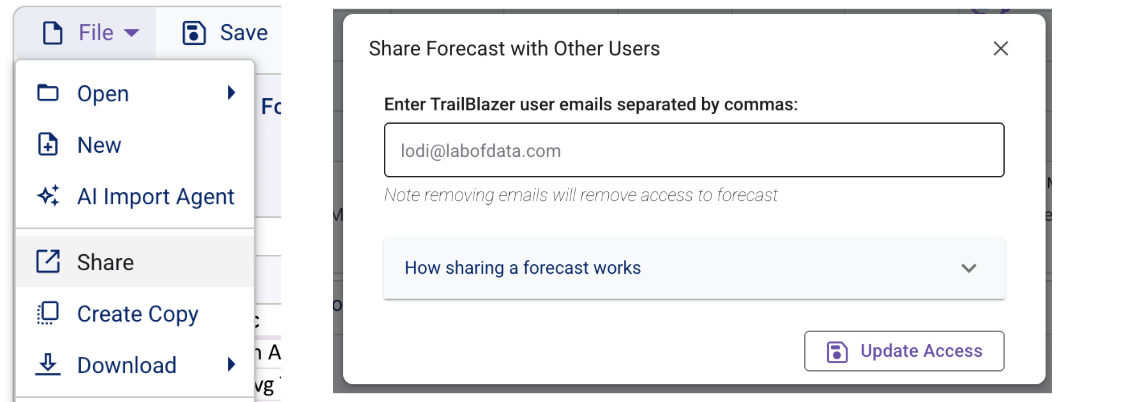
Share a copy of your forecast directly to other TrailBlazer users. They will receive a standalone copy to work on, ensuring your data remains untouched.
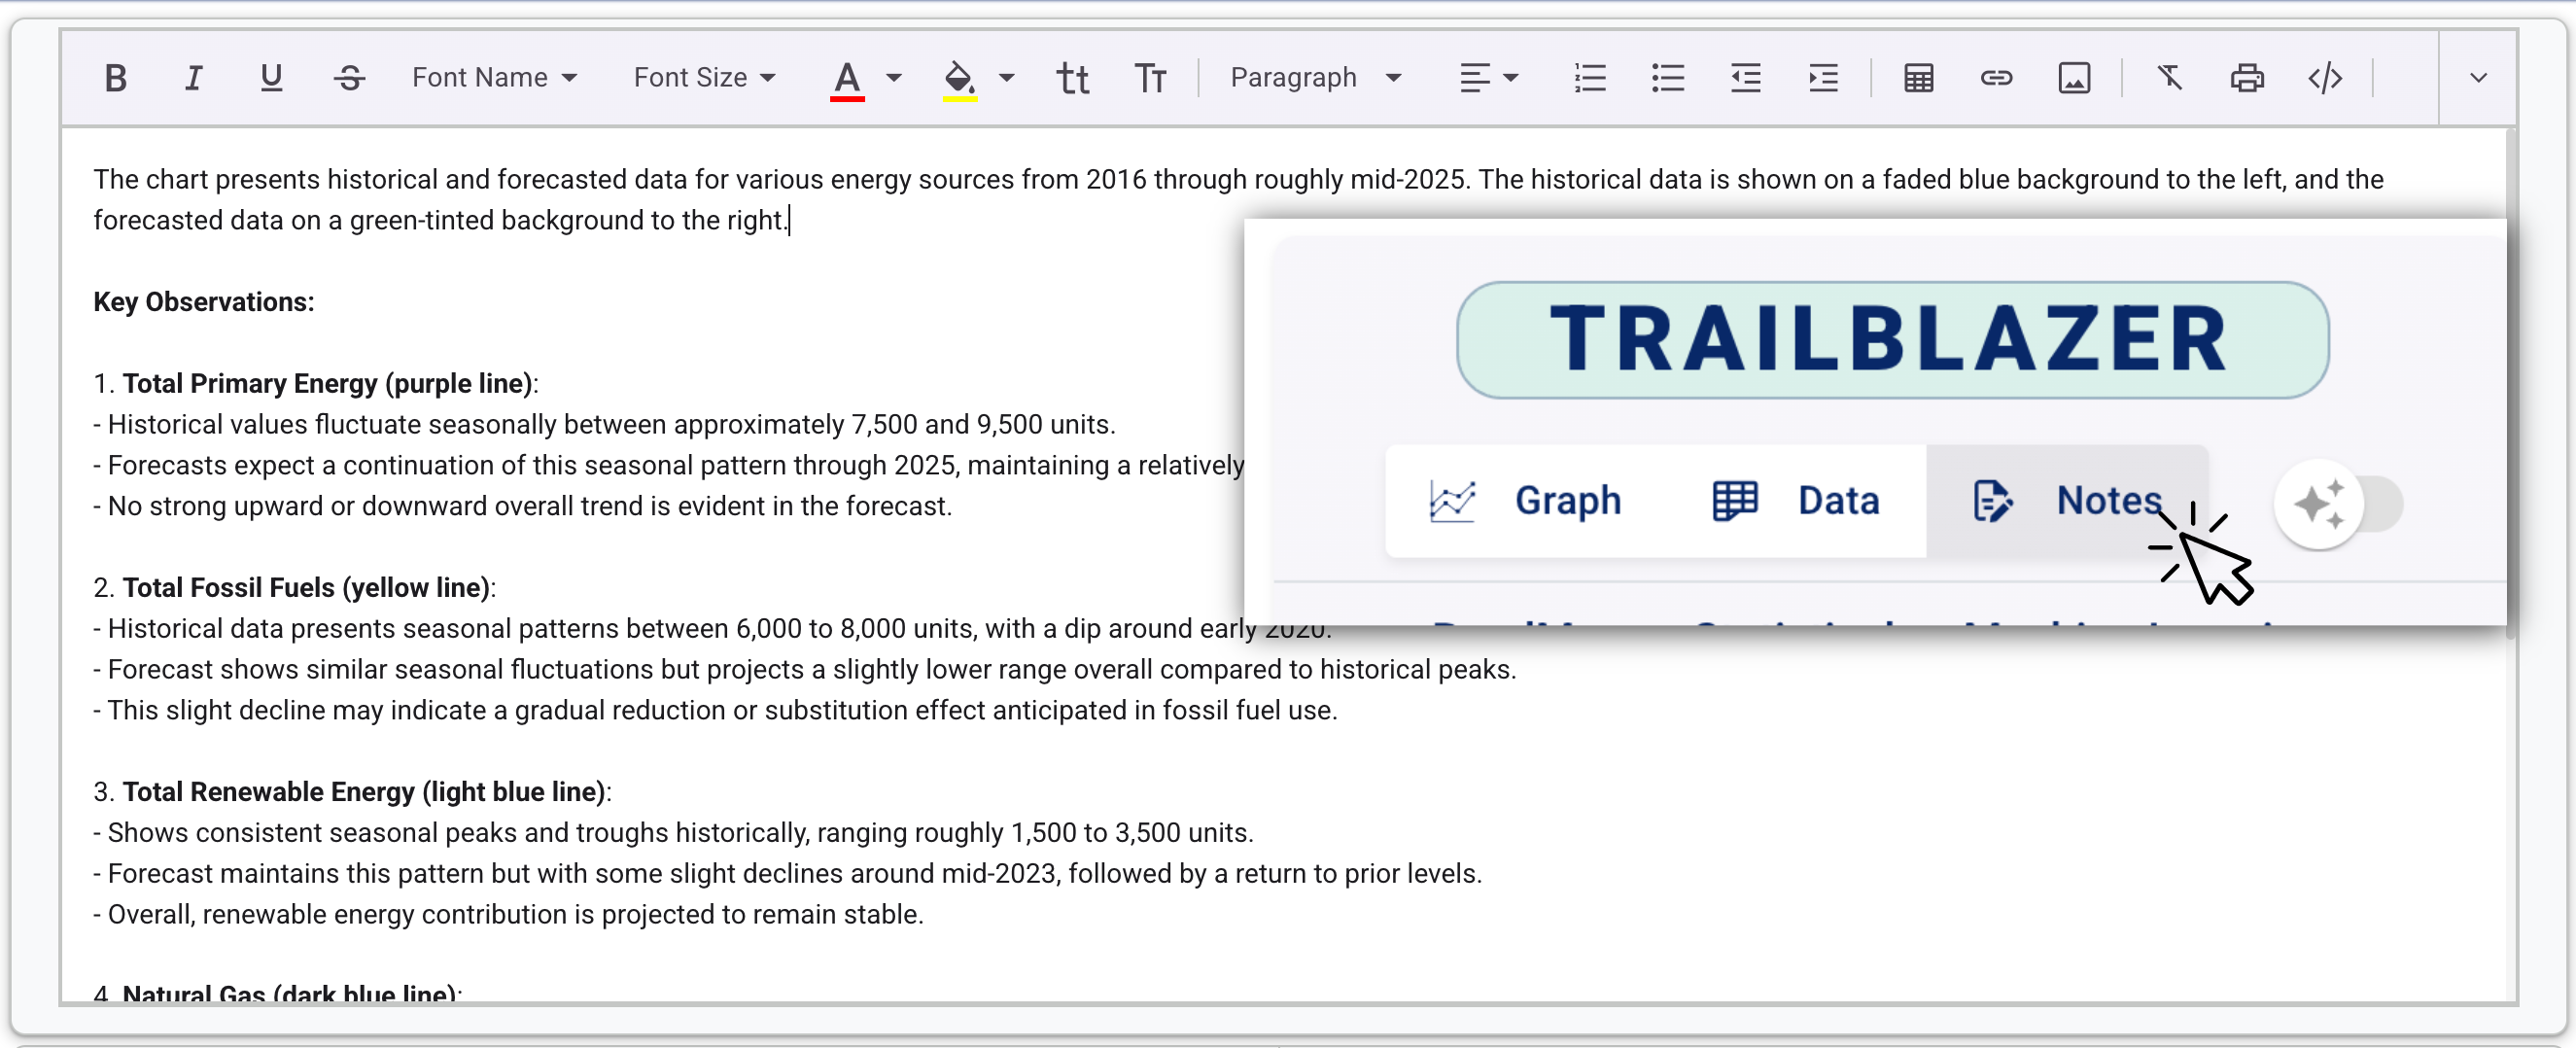
6. Notes & AI Analysis
Notes
The Notes section allows you to save your qualitative and quantitative analysis in a rich text document. These notes are saved alongside your spreadsheet/forecast.
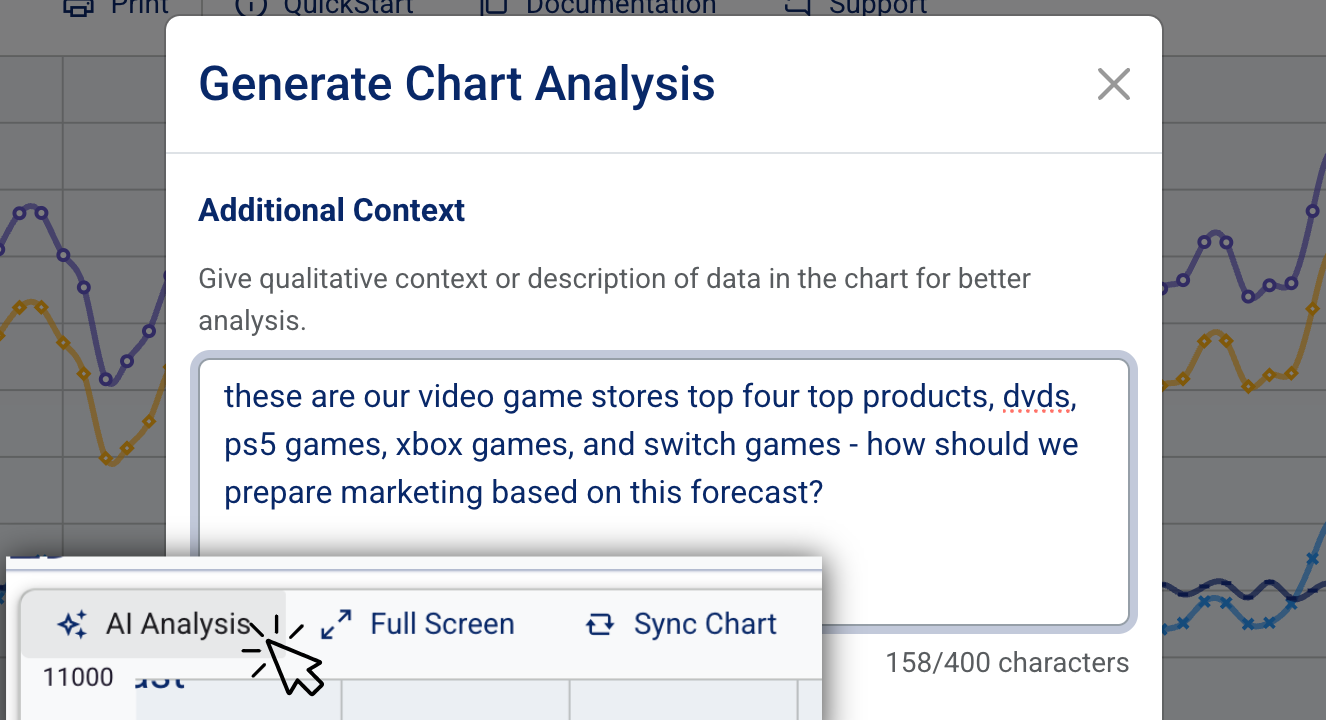
AI Analysis
Use AI Analysis to interact analyze with your historical and forecast data within your graph. Simply add context or ask strategic questions, such as how to market to drive sales and the AI will evaluate your chart for seasonal accuracy and provide actionable insights based on your metrics. AI Analysis will be added to your Notes.
Spreadsheet Notes
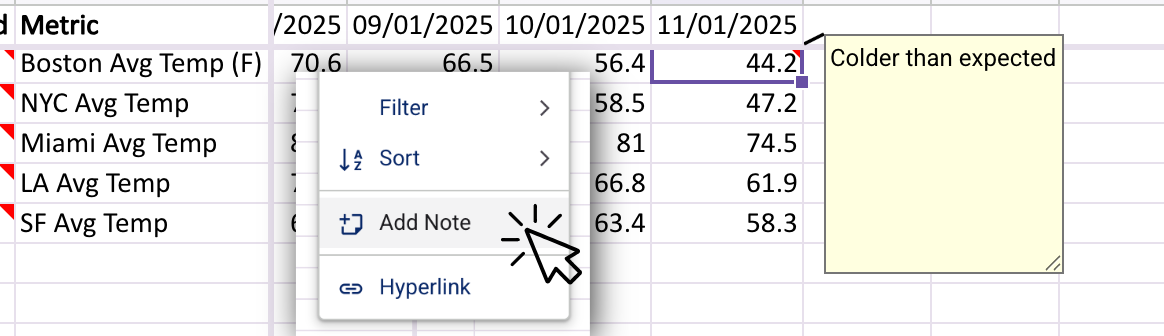
Add custom notes to individual spreadsheet cells. Simply Right-click any cell and select Add Note to attach your comments.
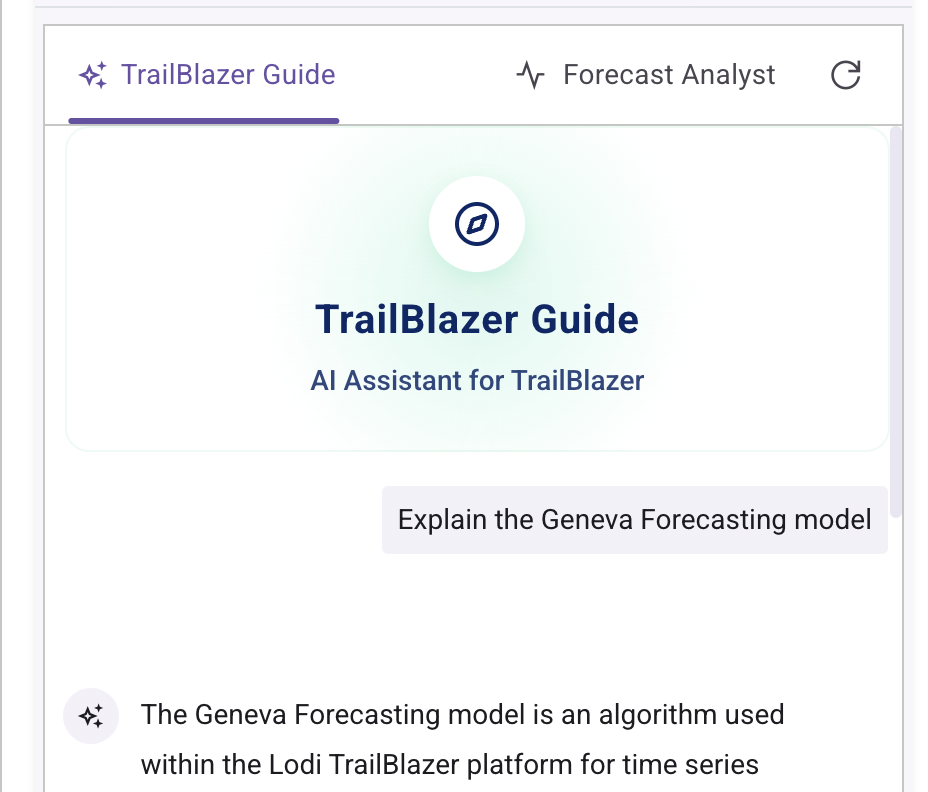
7. AI Assistants
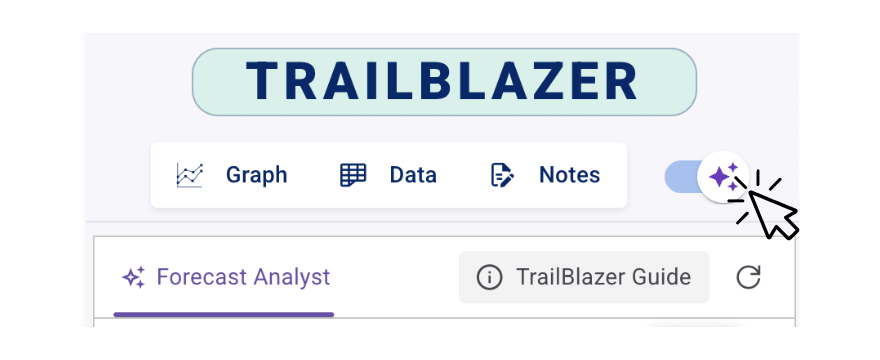
Select AI Assistants
Click the AI Switch in the top right of the Side Panel to access the TrailBlazer AI Assistants.
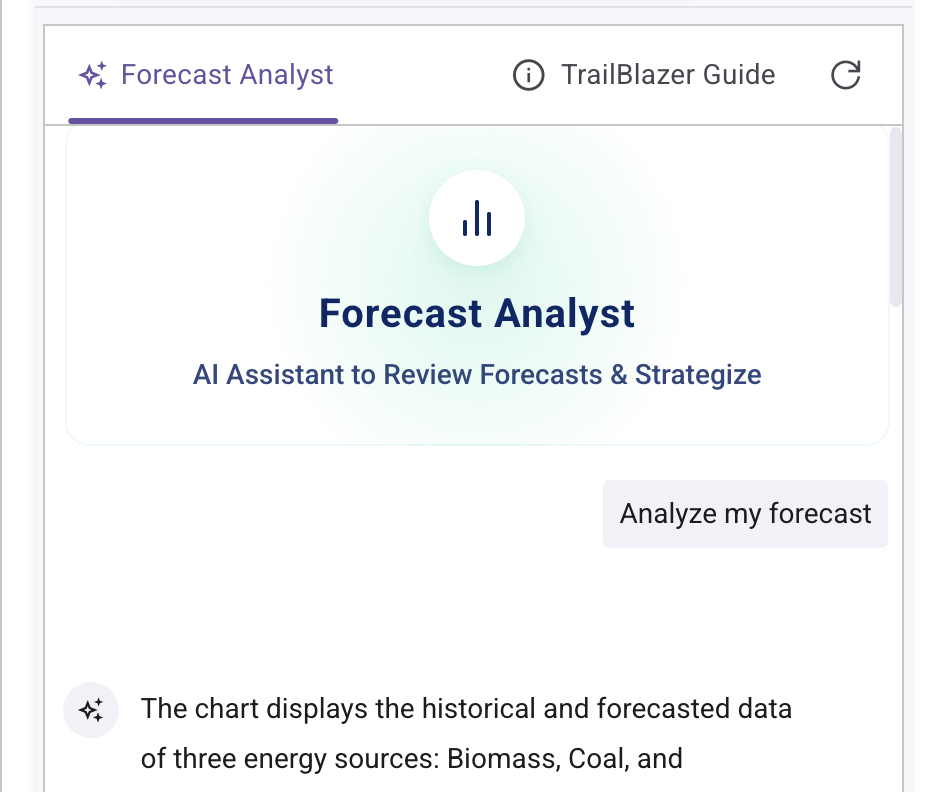
Forecast Analyst (Default)
The Forecast Analyst is your dedicated partner for deep dives into your data. Unlike static reports, this assistant holds a continuous conversation about your chart, helping you review forecasts, answer complex business questions, and explore suggested follow-up strategies in real-time.
TrailBlazer Guide
The TrailBlazer Guide is your expert resource for the platform. Consult this guide to understand specific forecasting methods, TrailBlazer documentation, or about how to navigate the TrailBlazer app effectively.
8. Managing Subscription
You can upgrade, downgrade, or cancel your subscription at any time via your user profile page.
Quick Tip: This guide appears automatically to help you get started. It will continue to pop up on login until you save your first Forecast. This guide can be accessed by clicking QuickStart above the graph component.
Enjoy Reading This Article?
Here are some more articles you might like to read next: